Note
Click here to download the full example code
Plot Volume Data
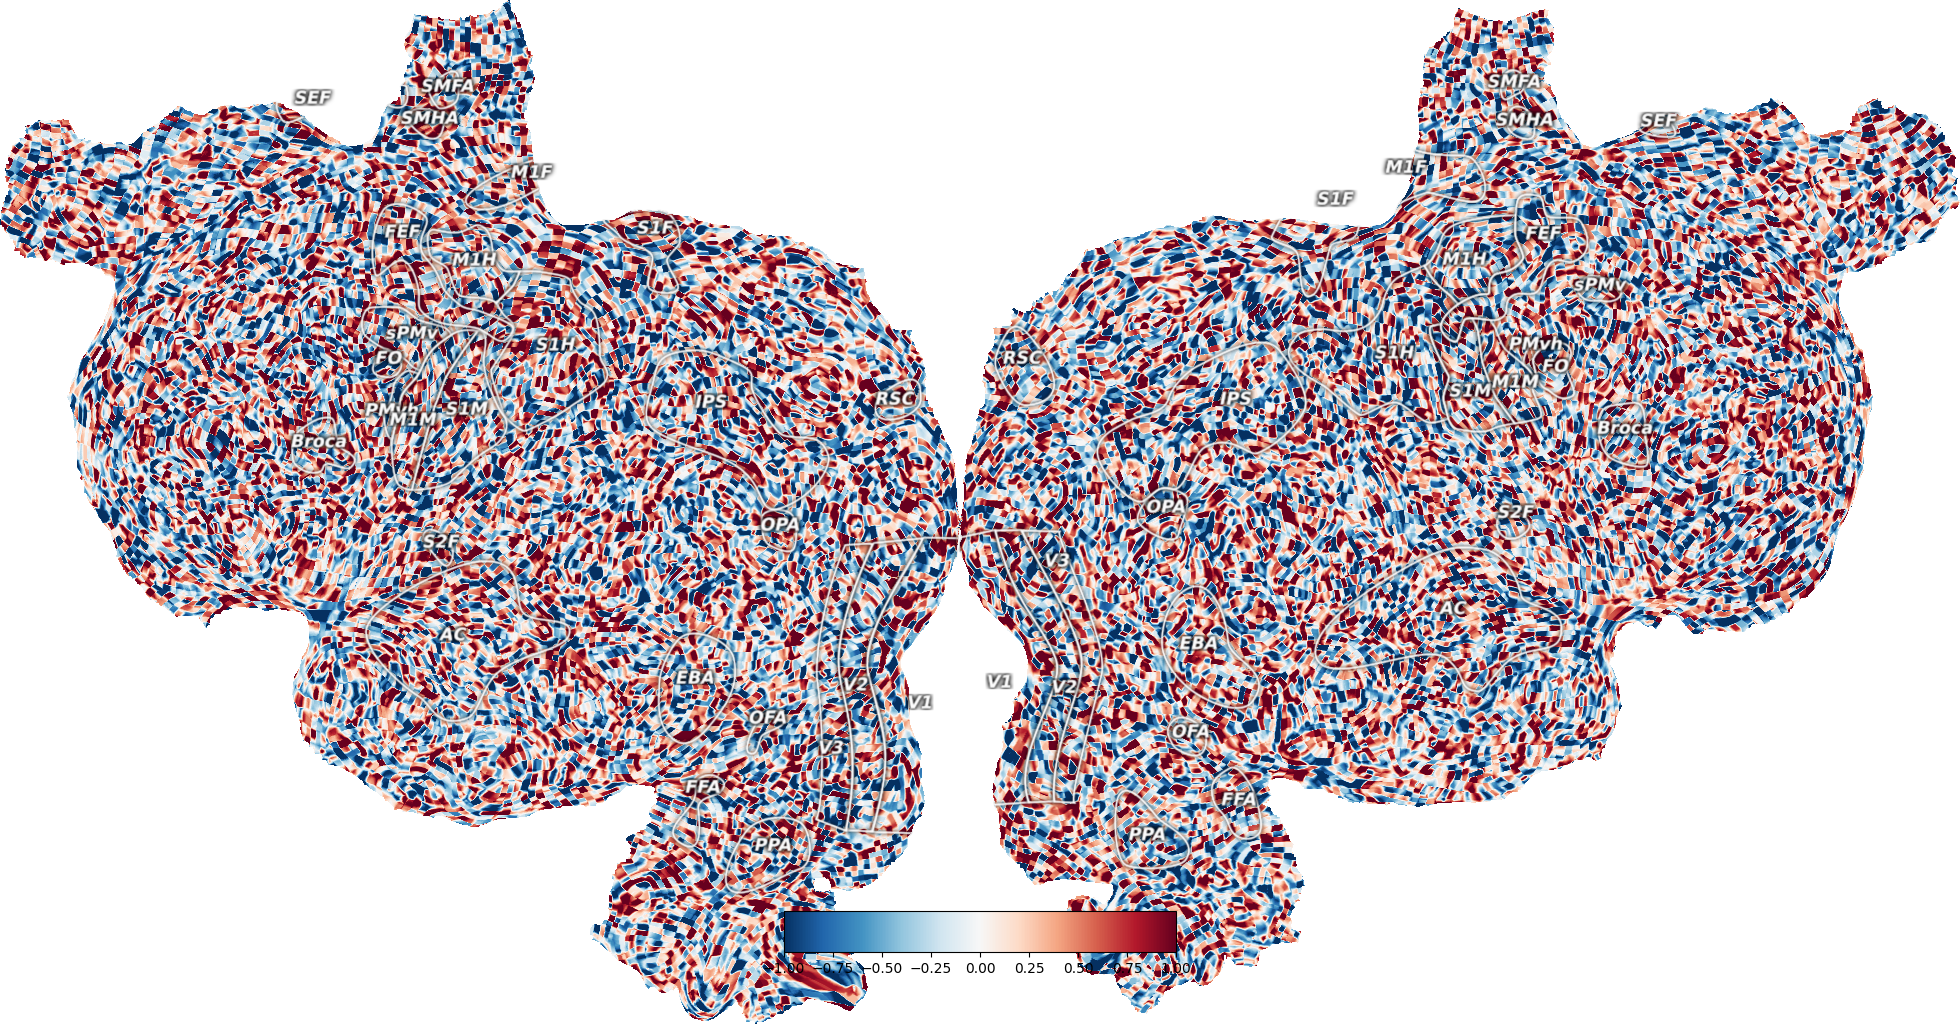
This plots example volume data onto an example subject, S1, onto a flatmap using quickflat. In order for this to run, you have to have a flatmap for this subject in the pycortex filestore.
The cortex.Volume object is instantiated with a numpy array of the same size as the scan for this subject and transform. Instead of the random test data, you can replace this with any numpy array of the correct dimensionality.
By changing the parameters vmin and vmax, you get thresholded data, as shown in the colorbar for the figure.
If you have NaN values within your array, those voxels show up transparent on the brain.
import cortex
import numpy as np
np.random.seed(1234)
import matplotlib.pyplot as plt

subject = 'S1'
xfm = 'fullhead'

# Creating a random dataset that is the shape for this transform with one
# entry for each voxel
test_data = np.random.randn(31, 100, 100)

# This creates a Volume object for our test dataset for the given subject
# and transform
vol_data = cortex.Volume(test_data, subject, xfm)
cortex.quickshow(vol_data)
plt.show()

# Can also alter the minimum and maximum values shown on the colorbar
vol_data_thresh = cortex.Volume(test_data, subject, xfm, vmin=-1, vmax=1)
cortex.quickshow(vol_data_thresh)
plt.show()

# If you have NaN values, those voxels show up transparent on the brain
test_data[10:15, :, :] = np.nan
vol_data_nan = cortex.Volume(test_data, subject, xfm)
cortex.quickshow(vol_data_nan)
plt.show()
Total running time of the script: ( 0 minutes 6.633 seconds)


