Note
Click here to download the full example code
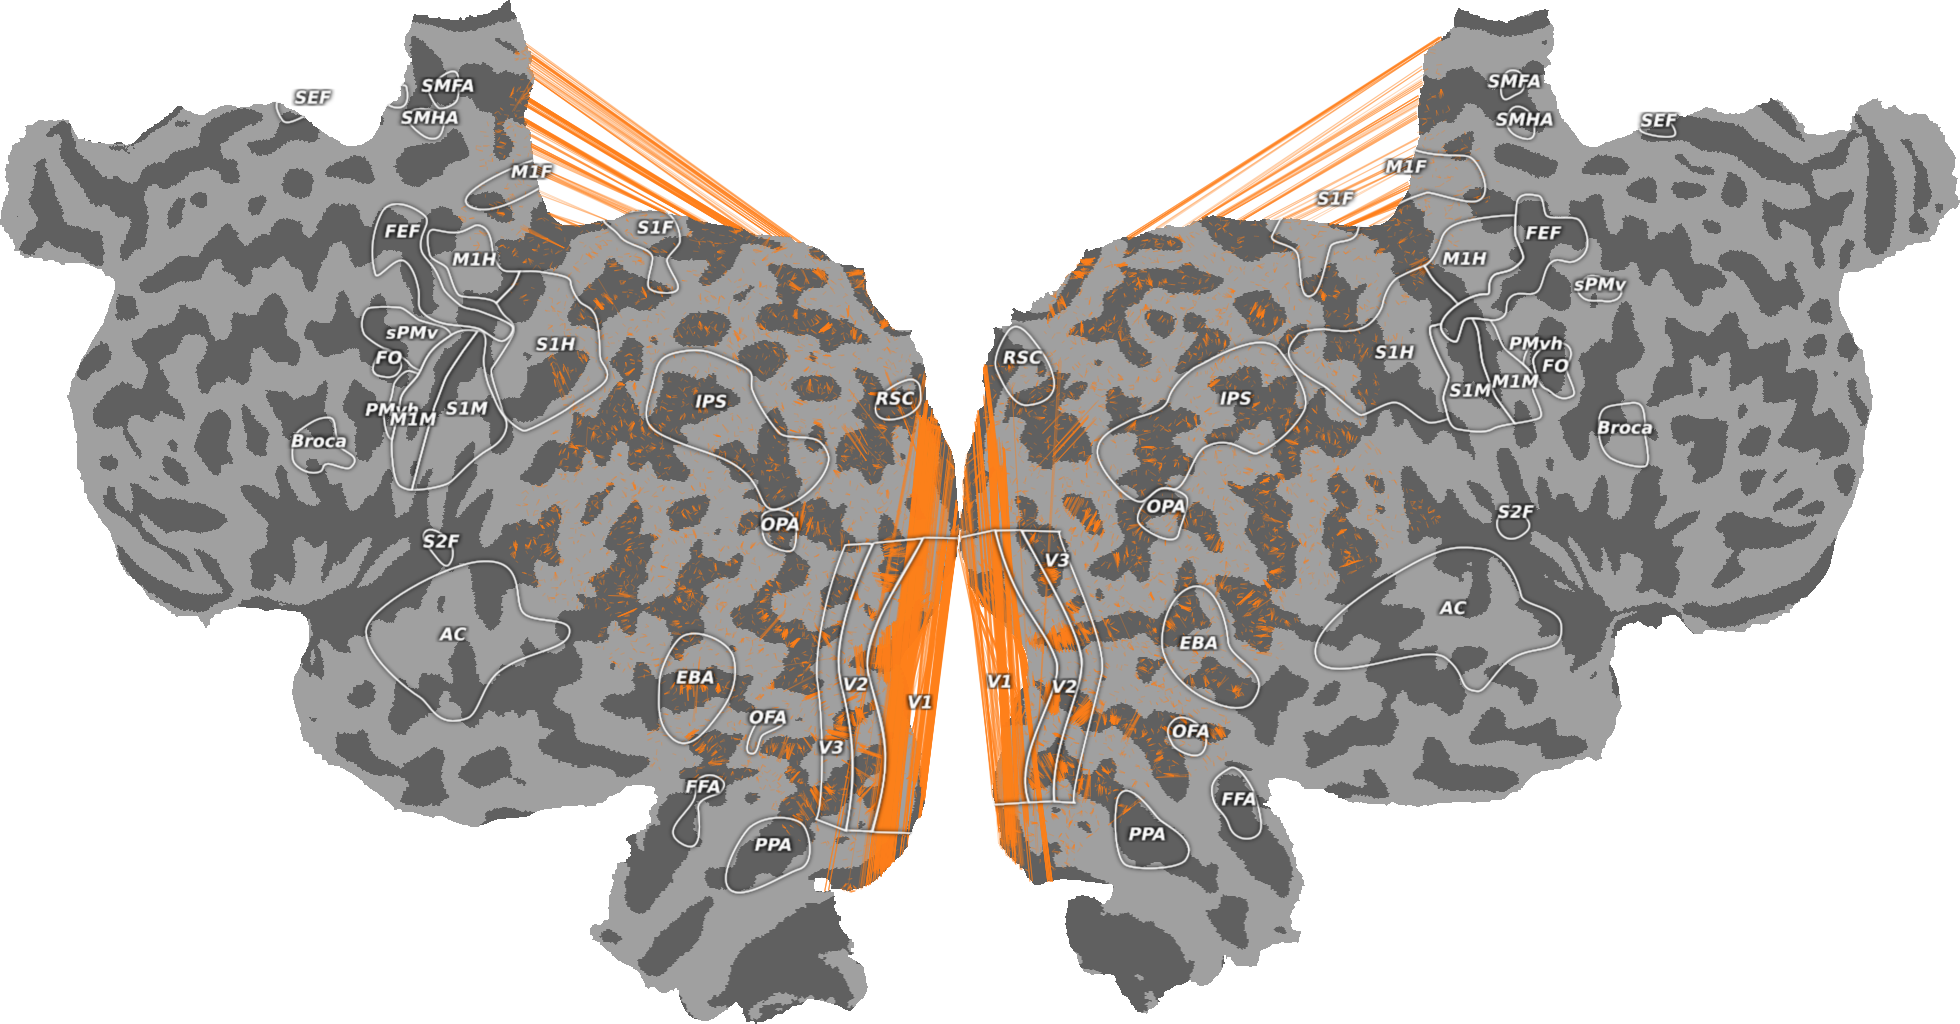
Plot which vertices are inside the same voxels
Show lines connecting vertices on the flatmap that are actually within the same voxels in a given scan.
Here, we used advanced compositing to be explicit about display options for the connecting lines.

Out:
Generating a flatmap cache
Shared voxel array not found, generating...
Caching mapper...
/home/travis/build/gallantlab/pycortex/cortex/mapper/samplers.py:10: RuntimeWarning: invalid value encountered in greater
  valid = np.logical_and(valid, np.logical_and(coords[:,0] > -.5, coords[:,0] < shape[2]+.5))
/home/travis/build/gallantlab/pycortex/cortex/mapper/samplers.py:10: RuntimeWarning: invalid value encountered in less
  valid = np.logical_and(valid, np.logical_and(coords[:,0] > -.5, coords[:,0] < shape[2]+.5))
/home/travis/build/gallantlab/pycortex/cortex/mapper/samplers.py:11: RuntimeWarning: invalid value encountered in greater
  valid = np.logical_and(valid, np.logical_and(coords[:,1] > -.5, coords[:,1] < shape[1]+.5))
/home/travis/build/gallantlab/pycortex/cortex/mapper/samplers.py:11: RuntimeWarning: invalid value encountered in less
  valid = np.logical_and(valid, np.logical_and(coords[:,1] > -.5, coords[:,1] < shape[1]+.5))
/home/travis/build/gallantlab/pycortex/cortex/mapper/samplers.py:12: RuntimeWarning: invalid value encountered in greater
  valid = np.logical_and(valid, np.logical_and(coords[:,2] > -.5, coords[:,2] < shape[0]+.5))
/home/travis/build/gallantlab/pycortex/cortex/mapper/samplers.py:12: RuntimeWarning: invalid value encountered in less
  valid = np.logical_and(valid, np.logical_and(coords[:,2] > -.5, coords[:,2] < shape[0]+.5))
import cortex
import numpy as np
import matplotlib.pyplot as plt

# Create an empty pycortex Volume
volume = cortex.Volume.empty(subject='S1', xfmname='retinotopy', value=np.nan)

# Plot a flatmap with the data projected onto the surface
fig = cortex.quickflat.make_figure(volume, with_curvature=True, with_colorbar=False)

# Advanced compositing addition of connected vertices.
# Note that this will not currently resize correctly with a figure.
lines = cortex.quickflat.composite.add_connected_vertices(fig, volume,
            exclude_border_width=None, color=(1.0, 0.5, 0.1, 0.6), linewidth=0.75,
            alpha=0.3, recache=True)
plt.show()
Total running time of the script: ( 2 minutes 25.777 seconds)