Note
Click here to download the full example code
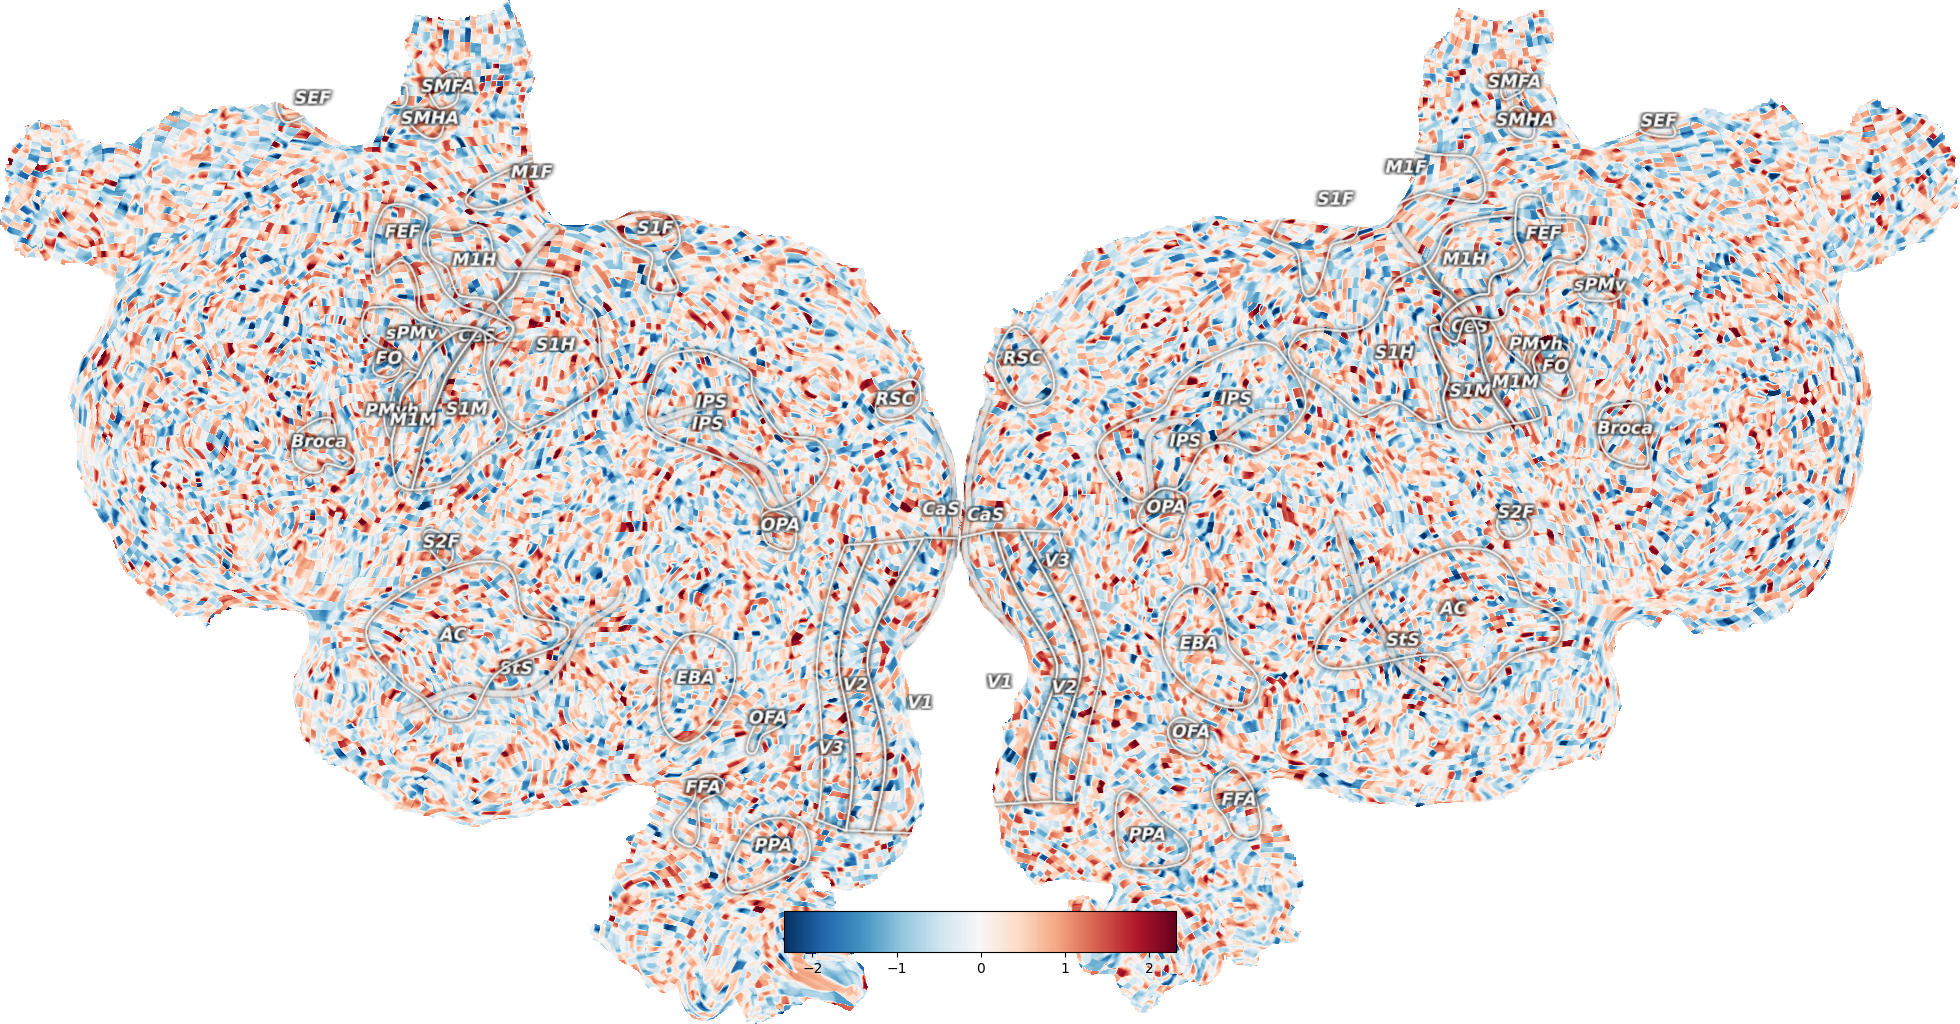
Plot sulci on the flatmap
The sulci are defined in a sub-layer of the sulci layer in <filestore>/<subject>/overlays.svg.
The parameter with_sulci in quickflat.make_figure controls displaying the sulci on the surface.

import cortex
import numpy as np
np.random.seed(1234)

# Create a random pycortex Volume
volume = cortex.Volume.random(subject='S1', xfmname='fullhead')

# Plot a flatmap with the data projected onto the surface
# Highlight the curvature and display the sulci
_ = cortex.quickflat.make_figure(volume,
                                 with_curvature=True,
                                 with_sulci=True)
Total running time of the script: ( 0 minutes 3.843 seconds)